


Why lithium batteries do not suit Wearable IoT application…or do they?
- Oct 12, 2018
- 7 min read
The IoT sphere is currently developing at a crazy pace. Every day, IoT devices are getting smaller and lighter. Considering the size of the elemental base on which IoT is built, a key element that affects both weight and size of the IOT device is precisely the elements of the power supply.
There are two power options for portable devices: a rechargeable battery and non-rechargeable battery. Typically, rechargeable batteries have better performance and they can produce more current, but they require a charging circuit. In addition, rechargeable batteries may be awkward to charge in some cases. Also, a rechargeable battery with additional components will carry greater weight than lithium non-rechargeable batteries, which in such cases are great for use.
Lithium non-rechargeable batteries have severe restrictions on how much current that they can give away. This greatly limits the possibility of using such non-rechargeable batteries. This article looks at how to circumvent these restrictions so that lithium non-rechargeable batteries can be used with IoT devices.
In theory, an ideal battery can produce an infinitely large current.But in the real world, this does not happenunfortunately. That’s because the current is limited by the internal structure of the battery. Figure 1 shows an equivalent replacement circuit (mathematical model) of an ideal and real battery.

Figure 1 - An equivalent circuit for replacing an ideal and real battery.
Rl - resistance of leakage of self-discharge. It is impossible to measure it, but it is possible to estimate it approximately on the basis of the storage period of the battery, taking into account its capacity.
Rin — internal resistance, which limits the maximum current that can be produced by the battery. With a decrease in temperature, it sharply increases, which limits the output power when working in the cold. Also, internal resistance is gradually increasing in the discharge process due to the lower conductivity of the electrolyte.
According to Ohm's law, the voltage drop on Rin is equal to I * R. As mentioned above, Rin increases with battery discharge. Accordingly, the load of the battery with a constant current will cause a different voltage drop. When the battery is completely charged, the voltage drop will be minimal;and when it is completely discharged, the voltage drop will be maximal. Therefore, it often happens that the device can still process the sensor values and save the value in memory (until the value of a current is small).However, when it starts to transmit data, it switches off due to the voltage being sharply decreased by the load. This is a known problem that is considered for CR2032 type batteries (see hereand here). In this article, other types of batteries have been tested by the SensiEDGE team.
Figure 2 shows the typical consumption graph of an IoT device. Most of the time, the IoT device works in sleep mode when it consumes several microamperes. From time to time, the device wakes up when interrupted by a timer or external interrupt, processes sensor values and transmits them via communication interfaces, usually BLE or WiFi. The time to process the sensor and the transmission takes about a few milliseconds. But during these several of milliseconds, current pulses up to 20 - 30 mA are generated, which will cause a significant voltage drop… especially if a battery is not new.

Figure 2 - Typical consumption graph of IoT devices
Let’s consider, for example, a device that has the following components: BLE module SPBTLE-1S, flash memory AT25XE041B, accelerometer LIS2DW12, as well as two LEDs. The estimated operating time of the device is about 30 active hours (when the device actively collects data from the accelerometer, stores it in external flash memory and transmits via BLE) or three months of moderate use (about 20 minutes per day). The components consumption current is shown in Table 1.
Table 1 - Current consumption of the device

Based on the table, we see that the calculated current consumption in SLEEP MODE is 23.95 μA, and 26.59 mA in ACTIVE MODE. Most manufacturers rate the capacity CR2032 at a current of 1mA. With the increase of acurrent, the battery degrades faster and the internal resistance increases faster. Ultimately, this results in a decrease of battery capacity.
We held a test of three batteries that are suitable for use in IoT devices, namely CR2032, CR2430 and CR2450 (Figure 3). Their sizes are given in Table 2. The battery discharge charts given in the datasheets CR2032, CR2430, CR2450 are all shown in Figures 4-6.

Figure 3 – Tested batteries
Table 2 – Battery sizes


Figure 4 – CR2032 Discharge Characteristics
Left: Continuous Discharge Characteristics. Load: 15K ohms - continuous 21°C (70°F) Typical Drain @ 2.9V: 0.19 mA;
Right: Pulse Discharge Characteristics Pulse Test at 21°C (70°F) Bkgnd Drain: Continuous 21°C (70°F) 15K ohms 0.19 mA @2.9V Pulse Drain: 2 seconds X 12 times/day 400 ohms ~6.8 mA @2.7V

Figure 5 – CR2430 Discharge Characteristics
Left: Typical Discharge Characteristics Load: 15 K ohms – Continuous Typical Drain @ 2.9 V: 0.19 mA
Right: Pulse Discharge Characteristics Pulse Test at 21°C (70°F). Bkgnd Drain: Continuous 15K ohms 0.19 mA @2.9V Pulse Drain: 2 seconds X 12 times/day 300 ohms 9.3 mA @2.7V

Figure 6 – CR2450 Discharge Characteristics
Left: Typical Discharge Characteristics Load: 7.5 K ohms – Continuous, Typical Drain @ 2.9 V: 0.39 mA
Right: Pulse Discharge Characteristics Pulse Test at 21°C (70°F). Bkgnd Drain: Continuous 7.5K ohms 0.39 mA @2.9V Pulse Drain: 2 seconds X 12 times/day 300 ohms 9.0 mA @2.7V
One can see that all the batteries chosen for the test are small in size and suitable for use in IoT applications. Even though the graphs and the discharge are given at impulse load, the load value for constructing the graphic was used far from those that are used in real IoT devices. Therefore, it is not enough to use the reference values alone when calculating the life of the device from the battery.
The test log was collected using SensiBLE with a modified firmware. The voltage and current were measured with the ADC using a special circuit, which is shown in Figure 7. The results of measurements were transmitted to the PC via BLE and stored in the file.

Figure 7 - Principal diagram of the buffer
The battery test was held in several modes:
1) Constant load with a resistance of 132 Ω (18.94 mA @ 2.5 V).
The test results are shown in Figure 8. Measurements were made every 100 ms. In the form, the charts are similar to those given in the datasheets. Due to the current in the test being much greater than given in the datasheet, the discharge time is smaller. For better visualization, the test results are summarized in Table 3. The table shows the discharge time to 1.8V.

Figure 8 - Chart of batteries discharge with a resistance 132 Ohm
Table 3 - Results of the test with the load 132 ohms

2) Impulse load with a 255R (9.8 mA @ 2.5 V) * 20 ms, 96.7 R (25.85 mA @ 2.5 V) * 20 ms, 78.47 R (31.86 mA @ 2.5 V) * 20 ms, 2460R (1.02 mA @ 2.5V) * 200 ms. The load was chosen based on the consumption of the device described earlier. This test was held with two types of batteries: CR2032 and CR2430. Test results are shown in Figures 9-18.
In this test, measurements were made with a period of 10 ms, which allowed to see the approximate shape of the signal.

Figure 9 - Discharge CR2032 with a pulse current, voltage values

Figure 10 - Discharge CR2032 with a pulse current, current values

Figure 11 - Enlarged CR2032 discharge chart at the beginning of the test

Figure 12 - Enlarged CR2032 discharge chart in the middle of the test

Figure 13 - Enlarged CR2032 discharge graph at the end of the test

Figure 14 - Discharge CR2430 with a pulse current, voltage values

Figure 15 - Discharge CR2430 with a pulse current, current values

Figure 16 - Enlarged CR2430 discharge chart at the beginning of the test

Figure 17 - Enlarged CR2430 discharge chart in the middle of the test

Figure 18 - Enlarged CR2430 discharge graph at the end of the test
From the results of the test, it is clearly seen that the more a battery is discharged, the more its voltage drops under the load – which in turn does not allow to take from the battery a large current. As mentioned above, this is due to an increase in the internal resistance of the battery when discharged. Also, in the graphs of discharge at the end of the test, it can be seen that when the 255R load is turned off and the 2460R is turned on, the battery is slowly restored, as the current of about 1 mA is the working for the battery.
The results of the pulse load test are summarized in Table 4. In the "time of discharge" column, the time for which the voltage drops to 1.8V is specified.
Table 4 - Pulse load test results.

3) Testing in a real device. In this mode, the CR2430 battery was tested.
As a real device, SensiBLE in the Sensors Fusion mode was chosen. In this mode, the device reads the accelerometer, gyroscope and magnetometer values. At these values, SensiBLE makes the orientation estimation of the device in space and transmits it to a BLE-connected smartphone, which in turn graphically displays the angle of the SensiBLE on the screen.
Figures 19-21 show SensiBLE consumption in the mode "wait for connection" and in "Sensors Fusion" mode taken by the oscilloscope using the circuit shown in Figure 7. On figure 21, a yellow graph is a voltage whilst red is a current. It is also worth mentioning that the SensiBLE device has capacitors that slightly smooth the voltage drop.

Figure 19 - SensiBLE consumption in "wait for connection" mode

Figure 20 - SensiBLE consumption in "Sensors Fusion" mode

Figure 21 - SensiBLE consumption when the battery is discharged
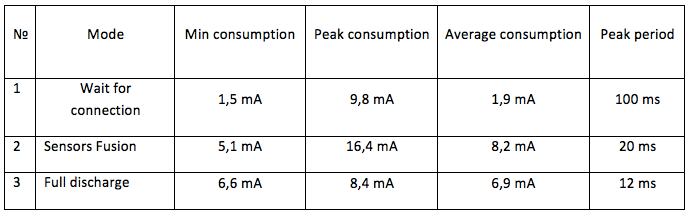
SensiBLE consumption is summarized in Table 5.
Table 5 - SensiBLE consumption
The chart of discharge the CR2430 battery is shown in Figure 22.

Figure22 – Discharge CR2430 SensiBLE. Sensors Fusion mode
The peaks at the end of the graph in Figure 22 are related to battery discharge and low power for SensiBLE to operate in Sensors Fusion mode.
From the initial power up to the first disconnection with the phone, SensiBLE continuously worked for almost 22 hours in the "Sensors Fusion" mode on the battery CR2430. By optimizing SensiBLE consumption, designers can achieve significantly longer working hours. Two batteries from different manufacturers were tested on SensiBLE. The first of these, at a price of about $ 1, worked in this mode for about 10 hours. The chart of another, with a price of about $ 2.5, is given above. The SensiBLE device working time from these batteries is almost twice as different, as their price reflect. It is important paying attention to this when choosing a battery for your IoT design. This indicates that different manufacturers use different technology when manufacturing batteries of the same type.
Consequently, such batteries are quite suitable for use. However, for this purpose, it is necessary to provide conditions where the peak currents are small. To reduce battery currents in peak loads, components with lower power consumption should be used, along with capacitors in power circuits.
Comments